
EV Battery
Health Report

Overall
83%
STATE OF HEALTH

MAX RANGE

268 Miles
83%
vs
322 Miles New
USABLE CAPACITY
83%
62.4
kWh
vs
75.0 kWh
New Usable
82.0 kWh
New Total
PREMATURE FAILURE RISK
 Low

FAST CHARGING HISTORY
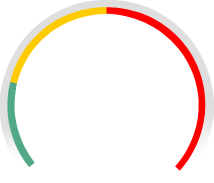 65%
CELL TEMPERATURE IMBALANCE
Low2020 Tesla Model 3 Long Range Performance Dual Motor AWD (18in)
VIN: 5YJ3E1EC0LF796164
TEST TIME: 10/21/2026 12:24 PM
TEST LOCATION: Tewksbury, MA
TEST OUTDOOR TEMPERATURE: 43 F
TEST STATE OF CHARGE: 27.6%
Odometer: 133,303 mi
OEM Battery Warranty*: 8 years / 120,000 mi
Cell Voltage Test
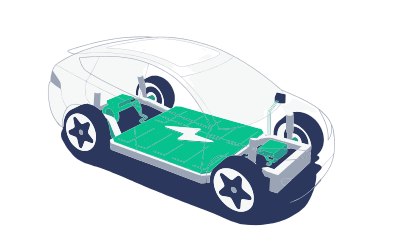
100% Balanced
RANGE MAP
Fuel vs Electricity Cost Comparison
+$2,701 Annual EV Cost Savings
Annual mileage
5,000 mi
25,000 mi
Charging Time & Cost
Cell Voltage Values
Cell Voltage Histogram
Vehicle Pictures

*This report, and any reliance upon it, is subject to our terms of service. Warranty may be extended in select states, including AZ, CA, CT, ME, MD, MA, NJ, NY, OR, RI, VT. Patents pending. 1A2B86C5535457384C202020FF063D28 3.0.5 3.48 (1) 5badce29-c92f-48d7-9e2d-a7272ed19f0a
Scan here for more details on your EV battery health.

EV Battery
Health Report
2020 Tesla Model 3 Long Range Performance Dual Motor AWD (18in)
VIN: 5YJ3E1EC0LF796164
TEST TIME: 10/21/2026 12:24 PM
TEST LOCATION: Tewksbury, MA
TEST OUTDOOR TEMPERATURE: 43 F
TEST STATE OF CHARGE: 27.6%
Odometer: 133,303 mi
OEM Battery Warranty*: 8 years / 120,000 mi
STATE OF HEALTH
MAX RANGE
268 Miles
83%
vs
322 Miles New
USABLE CAPACITY
83%
62.4
kWh
vs
75.0 kWh
New Usable
82.0 kWh
New Total
PREMATURE FAILURE RISK
LowFAST CHARGING HISTORY
65%CELL TEMPERATURE IMBALANCE
LowCell Voltage Test
100% Balanced
RANGE MAP
Fuel vs Electricity Cost Comparison
+$2,701 Annual EV Cost Savings
Annual mileage
5,000 mi
25,000 mi
Charging Time & Cost
Cell Voltage Values
Cell Voltage Histogram
Vehicle Pictures
*This report, and any reliance upon it, is subject to our (https://vsnew.com/terms). Warranty may be extended in select states, including AZ, CA, CT, ME, MD, MA, NJ, NY, OR, RI, VT. Patents pending.
1A2B86C5535457384C202020FF063D28 3.0.5 3.48 (1) 5badce29-c92f-48d7-9e2d-a7272ed19f0a
Scan here for more details on your EV battery health.
https://app.vsnew.com/ev/25066-5YJ3E1EC0LF796164-2020-Tesla-Model 3 Long Range Performance Dual Motor AWD (18in)