
EV Battery
Health Report

Overall
95%
STATE OF HEALTH

MAX RANGE

327 km
95%
vs
345 km New
USABLE CAPACITY
95%
55.0
kWh
vs
58.0 kWh
New Usable
62.0 kWh
New Total
PREMATURE FAILURE RISK
 Low

CELL TEMPERATURE IMBALANCE
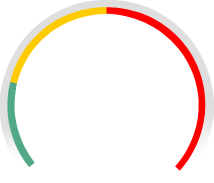 Low
Cupra Born
VIN: VSSZZZK1XRP029323
Date of First Registration: 07/11/2024
TEST TIME: 10/05/2026 2:47 PM
TEST LOCATION: MZ, RP
TEST OUTDOOR TEMPERATURE: 22 °C
TEST STATE OF CHARGE: 15.2%
Odometer: 18,671 km
OEM Battery Warranty*: 8 years / 160,000 km
Cell Voltage Test
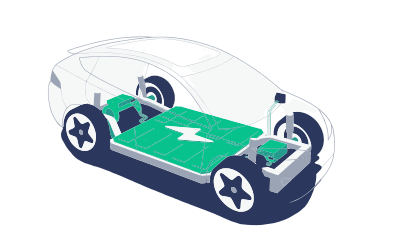
100% Balanced
RANGE MAP
Fuel vs Electricity Cost Comparison
+2,064 € Annual EV Cost Savings
Annual mileage
1,000 km
80,000 km
Charging Time & Cost
Cell Voltage Values
Cell Voltage Histogram
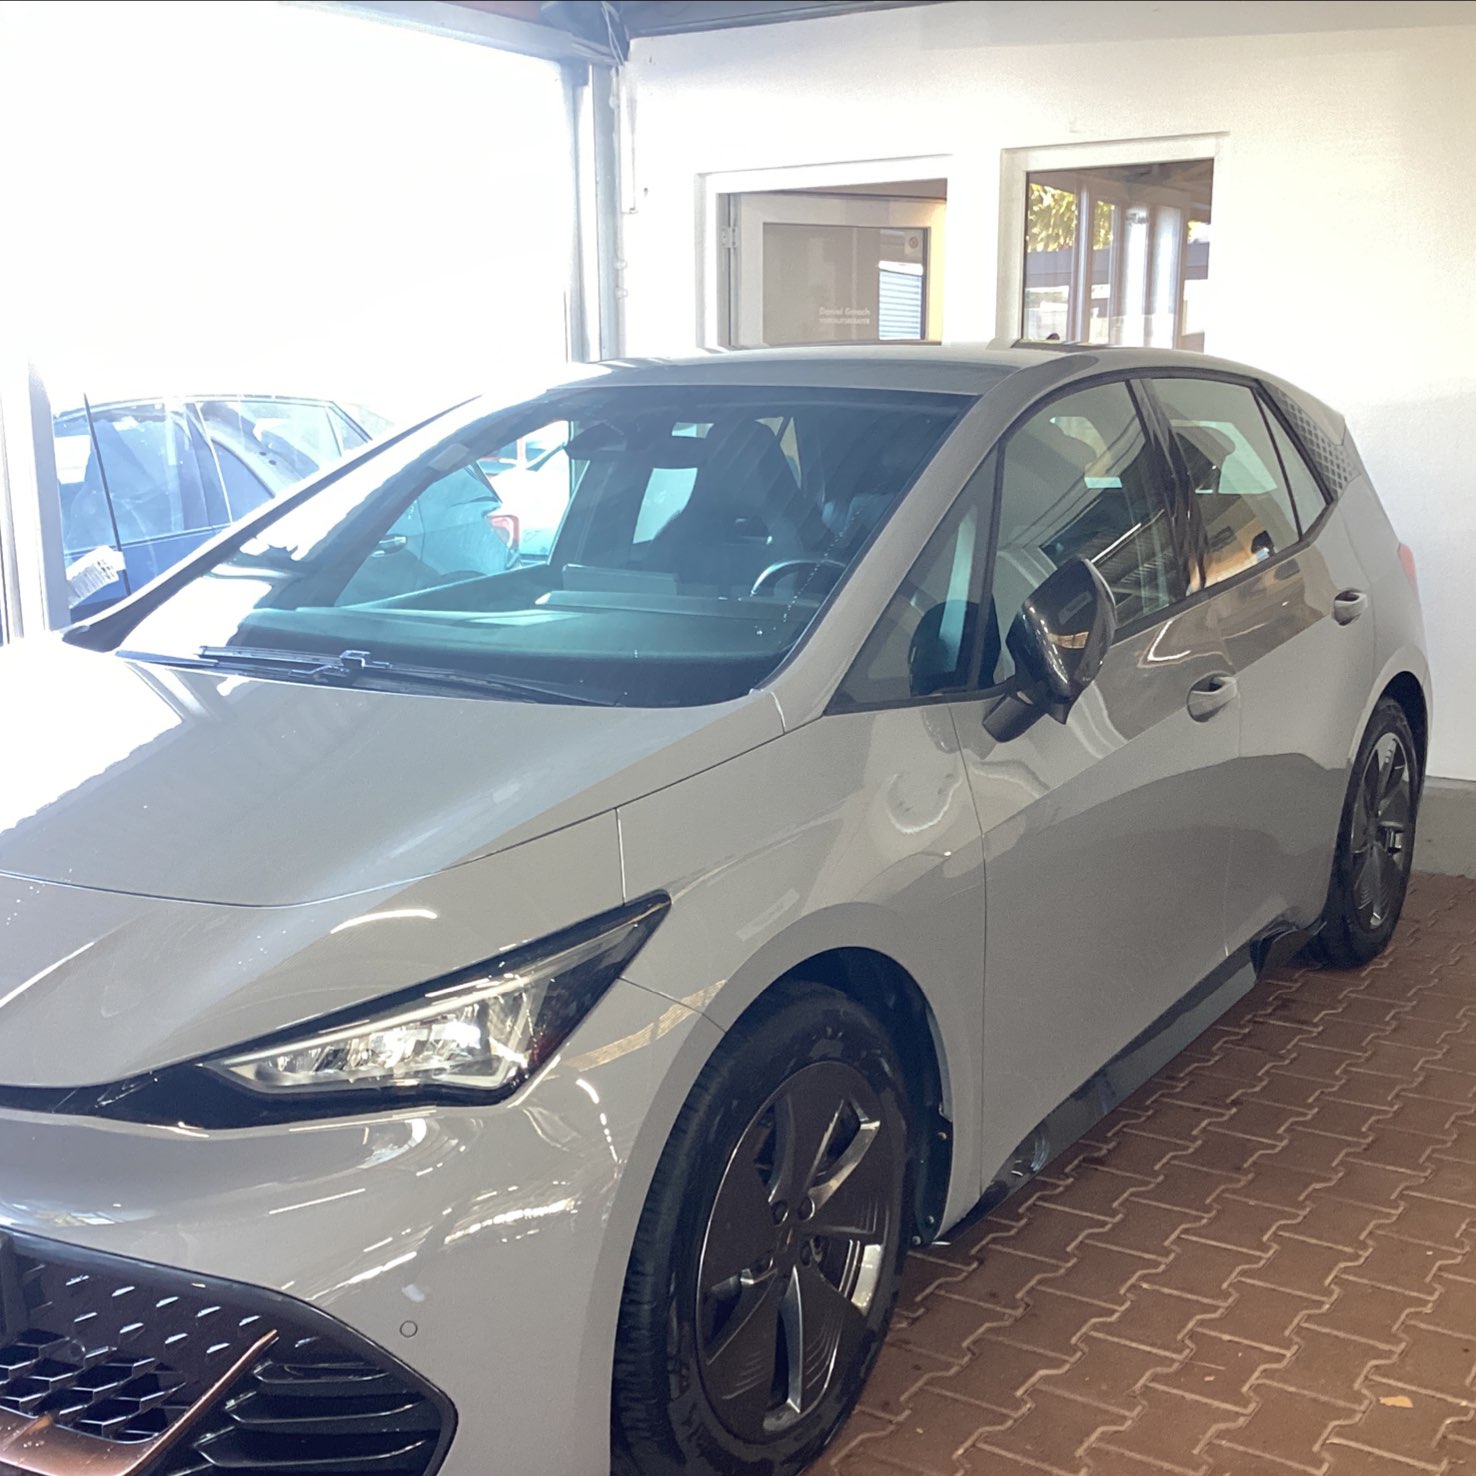
Vehicle Pictures

*This report, and any reliance upon it, is subject to our terms of service. Patents pending. Battery warranty information is listed for EU countries. Warranties for the UK, Ireland, and non EU countries may vary.929D359F534C364853202020FF06412C 3.0.5 3.46 (1) 7d78aa5e-8c3f-4063-b074-17efe055f687
Scan here for more details on your EV battery health.

EV Battery
Health Report
Cupra Born
VIN: VSSZZZK1XRP029323
Date of First Registration: 07/11/2024
TEST TIME: 10/05/2026 2:47 PM
TEST LOCATION: MZ, RP
TEST OUTDOOR TEMPERATURE: 22 °C
TEST STATE OF CHARGE: 15.2%
Odometer: 18,671 km
OEM Battery Warranty*: 8 years / 160,000 km
STATE OF HEALTH
MAX RANGE
327 km
95%
vs
345 km New
USABLE CAPACITY
95%
55.0
kWh
vs
58.0 kWh
New Usable
62.0 kWh
New Total
PREMATURE FAILURE RISK
LowCELL TEMPERATURE IMBALANCE
LowCell Voltage Test
100% Balanced
Balanced
Replaced
Fair
Failing
Unreported
RANGE MAP
Fuel vs Electricity Cost Comparison
+2,064 € Annual EV Cost Savings
Annual mileage
1,000 km
80,000 km
Charging Time & Cost
Cell Voltage Values
Cell Voltage Histogram
Vehicle Pictures
*This report, and any reliance upon it, is subject to our (https://vsnew.com/terms). Patents pending. Battery warranty information is listed for EU countries. Warranties for the UK, Ireland, and non EU countries may vary.
929D359F534C364853202020FF06412C 3.0.5 3.46 (1) 7d78aa5e-8c3f-4063-b074-17efe055f687
Scan here for more details on your EV battery health.
https://app.vsnew.com/ev/23647-VSSZZZK1XRP029323-Cupra-Born