
EV Battery
Health Report

Overall
94%
STATE OF HEALTH

MAX RANGE

379 Miles
94%
vs
402 Miles New
USABLE CAPACITY
94%
92.3
kWh
vs
98.0 kWh
New Usable
PREMATURE FAILURE RISK
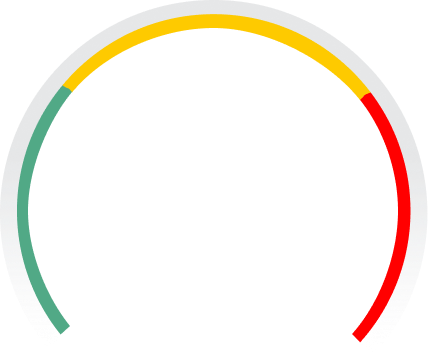 Low

CELL TEMPERATURE IMBALANCE
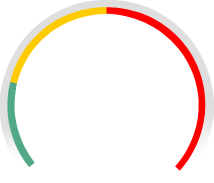 Low
2020 Tesla Model S Long Range Plus
VIN: 5YJSA1E26LF365570
TEST TIME: 08/10/2026 2:28 PM
TEST LOCATION: Carrollton, TX
TEST OUTDOOR TEMPERATURE: 85 F
TEST STATE OF CHARGE: 66.0%
Odometer: 49,928 mi
Battery Manufacturing Date: September 2019
Battery Manufacturing Status: Remanufactured 1 time(s)
OEM Battery Warranty*: 8 years / 150,000 mi
Cell Voltage Test
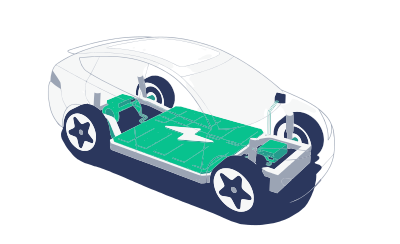
100% Balanced
RANGE MAP
Fuel vs Electricity Cost Comparison
+$2,676 Annual EV Cost Savings
Annual mileage
5,000 mi
25,000 mi
Charging Time & Cost
Cell Voltage Values
Cell Voltage Histogram
*This report, and any reliance upon it, is subject to our terms of service. Warranty may be extended in select states, including AZ, CA, CT, ME, MD, MA, NJ, NY, OR, RI, VT. Patents pending. 71DE2E205338575751202020FF130537 3.0.5 3.39 ce40fd6d-fafa-439d-89ad-e1750a27f73f
Scan here for more details on your EV battery health.

EV Battery
Health Report
2020 Tesla Model S Long Range Plus
VIN: 5YJSA1E26LF365570
TEST TIME: 08/10/2026 2:28 PM
TEST LOCATION: Carrollton, TX
TEST OUTDOOR TEMPERATURE: 85 F
TEST STATE OF CHARGE: 66.0%
Odometer: 49,928 mi
Battery Manufacturing Date: September 2019
Battery Manufacturing Status: Remanufactured 1 time(s)
OEM Battery Warranty*: 8 years / 150,000 mi
STATE OF HEALTH
MAX RANGE
379 Miles
94%
vs
402 Miles New
USABLE CAPACITY
94%
92.3
kWh
vs
98.0 kWh
New Usable
PREMATURE FAILURE RISK
LowCELL TEMPERATURE IMBALANCE
LowCell Voltage Test
100% Balanced
RANGE MAP
Fuel vs Electricity Cost Comparison
+$2,676 Annual EV Cost Savings
Annual mileage
5,000 mi
25,000 mi
Charging Time & Cost
Cell Voltage Values
Cell Voltage Histogram
*This report, and any reliance upon it, is subject to our (https://vsnew.com/terms). Warranty may be extended in select states, including AZ, CA, CT, ME, MD, MA, NJ, NY, OR, RI, VT. Patents pending.
71DE2E205338575751202020FF130537 3.0.5 3.39 ce40fd6d-fafa-439d-89ad-e1750a27f73f
Scan here for more details on your EV battery health.
https://app.vsnew.com/ev/19697-5YJSA1E26LF365570-2020-Tesla-Model S Long Range Plus