
EV Battery
Health Report

Overall
98%
2024 Toyota Prius Prime SE
VIN: JTMAAAAA0RA038592
TEST TIME: 01/21/2025 5:31 PM
TEST LOCATION: Napa, CA
TEST OUTDOOR TEMPERATURE: 43 °F
TEST STATE OF CHARGE: 82.0%
Odometer: 4,982 mi
OEM Battery Warranty*: 10 years / 150,000 mi
+€1.400
Battery Value
vs the Average Toyota Prius Prime SE
+$850
Below Average Risk
Internal Pack Failure Risk

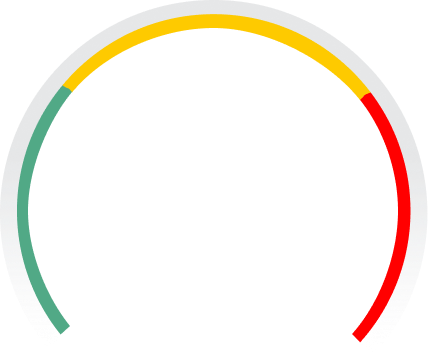 Low

+$600
Below Average Risk
External Care Failure Risk
Low-$50
Below 98% Average Capacity
MAX RANGE

43 Miles
98%
vs
44 Miles New
STATE OF HEALTH
USABLE CAPACITY
98%
13.4
kWh
vs
13.6 kWh
New Usable
PREMATURE FAILURE RISK
LowCELL TEMPERATURE IMBALANCE
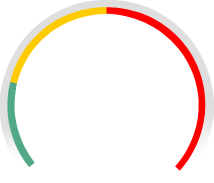 Low
Cell Voltage Test
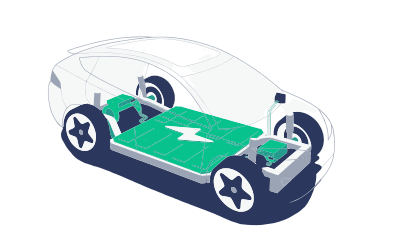
100% Balanced
RANGE MAP
Fuel vs Electricity Cost Comparison
+$2,530 Annual EV Cost Savings
Annual mileage
5,000 mi
25,000 mi
Charging Time & Cost
Cell Voltage Values
Cell Voltage Histogram
Vehicle Pictures

*This report, and any reliance upon it, is subject to our terms of service. Patents pending. 9D5D0966535457384C202020FF063E28 2.6.5 1.55 a67f7e5d-02b9-4dfd-90f0-cac5540ee7d4
Scan here for more details on your EV battery health.

EV Battery
Health Report
2024 Toyota Prius Prime SE
VIN: JTMAAAAA0RA038592
TEST TIME: 01/21/2025 5:31 PM
TEST LOCATION: Napa, CA
TEST OUTDOOR TEMPERATURE: 43 °F
TEST STATE OF CHARGE: 82.0%
Odometer: 4,982 mi
OEM Battery Warranty*: 10 years / 150,000 mi
STATE OF HEALTH
MAX RANGE
43 Miles
98%
vs
44 Miles New
USABLE CAPACITY
98%
13.4
kWh
vs
13.6 kWh
New Usable
PREMATURE FAILURE RISK
LowCELL TEMPERATURE IMBALANCE
LowCell Voltage Test
100% Balanced
Balanced
Replaced
Fair
Failing
Unreported
RANGE MAP
Fuel vs Electricity Cost Comparison
+$2,530 Annual EV Cost Savings
Annual mileage
5,000 mi
25,000 mi
Charging Time & Cost
Cell Voltage Values
Cell Voltage Histogram
Vehicle Pictures
*This report, and any reliance upon it, is subject to our (https://vsnew.com/terms). Patents pending.
9D5D0966535457384C202020FF063E28 2.6.5 1.55 a67f7e5d-02b9-4dfd-90f0-cac5540ee7d4
Scan here for more details on your EV battery health.
https://app.vsnew.com/ev/2666-JTMAAAAA0RA038592-2024-Toyota-Prius Prime SE