
EV Battery
Health Report

Overall
92%
2025 Tesla Model 3 Long Range RWD-I (19in wheels)
VIN: 5YJ3E1EA0SF981974
TEST TIME: 11/09/2026 3:34 PM
TEST LOCATION: Carrollton, TX
TEST OUTDOOR TEMPERATURE: 61 °F
TEST STATE OF CHARGE: 73.0%
Odometer: 17,757 mi
OEM Battery Warranty*: 8 years / 120,000 mi
+€1.400
Battery Value
vs the Average Tesla Model 3 Long Range RWD-I (19in wheels)
+$850
Below Average Risk
Internal Pack Failure Risk

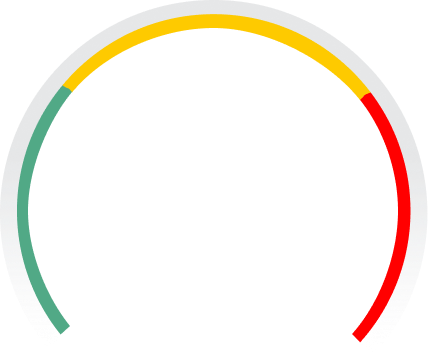 Low

+$600
Below Average Risk
External Care Failure Risk
Low-$50
Below 92% Average Capacity
MAX RANGE

317 Miles
92%
vs
346 Miles New
STATE OF HEALTH
USABLE CAPACITY
92%
68.7
kWh
vs
75.0 kWh
New Usable
78.1 kWh
New Total
PREMATURE FAILURE RISK
LowCELL TEMPERATURE IMBALANCE
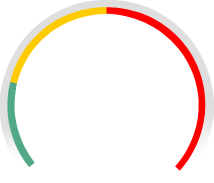 Low
Cell Voltage Test
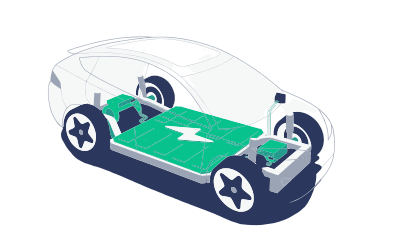
100% Balanced
RANGE MAP
Fuel vs Electricity Cost Comparison
+$2,737 Annual EV Cost Savings
Annual mileage
5,000 mi
25,000 mi
Charging Time & Cost
Cell Voltage Values
Cell Voltage Histogram
*This report, and any reliance upon it, is subject to our terms of service. Warranty may be extended in select states, including AZ, CA, CT, ME, MD, MA, NJ, NY, OR, RI, VT. Patents pending. E8CB93BD534633594B202020FF082604 3.0.5 3.47 a30e5df5-6811-49e9-9a16-d4893c582146
Scan here for more details on your EV battery health.

EV Battery
Health Report
2025 Tesla Model 3 Long Range RWD-I (19in wheels)
VIN: 5YJ3E1EA0SF981974
TEST TIME: 11/09/2026 3:34 PM
TEST LOCATION: Carrollton, TX
TEST OUTDOOR TEMPERATURE: 61 °F
TEST STATE OF CHARGE: 73.0%
Odometer: 17,757 mi
OEM Battery Warranty*: 8 years / 120,000 mi
STATE OF HEALTH
MAX RANGE
317 Miles
92%
vs
346 Miles New
USABLE CAPACITY
92%
68.7
kWh
vs
75.0 kWh
New Usable
78.1 kWh
New Total
PREMATURE FAILURE RISK
LowCELL TEMPERATURE IMBALANCE
LowCell Voltage Test
100% Balanced
Balanced
Replaced
Fair
Failing
Unreported
RANGE MAP
Fuel vs Electricity Cost Comparison
+$2,737 Annual EV Cost Savings
Annual mileage
5,000 mi
25,000 mi
Charging Time & Cost
Cell Voltage Values
Cell Voltage Histogram
*This report, and any reliance upon it, is subject to our (https://vsnew.com/terms). Warranty may be extended in select states, including AZ, CA, CT, ME, MD, MA, NJ, NY, OR, RI, VT. Patents pending.
E8CB93BD534633594B202020FF082604 3.0.5 3.47 a30e5df5-6811-49e9-9a16-d4893c582146
Scan here for more details on your EV battery health.
https://app.vsnew.com/ev/26590-5YJ3E1EA0SF981974-2025-Tesla-Model 3 Long Range RWD-I (19in wheels)