
EV Battery
Health Report

Overall
78%
2018 Tesla Model 3 Long Range Dual Motor AWD
VIN: 5YJ3E1EB8JF109887
TEST TIME: 08/10/2026 5:53 PM
TEST STATE OF CHARGE: 69.5%
Odometer: 231,244 km
OEM Battery Warranty*: 8 years / 192,000 km
In Service: October 20, 2018
+€1.400
Battery Value
vs the Average Tesla Model 3 Long Range Dual Motor AWD
+$850
Below Average Risk
Internal Pack Failure Risk

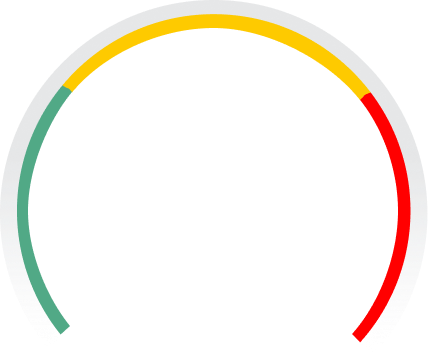 Low

+$600
Below Average Risk
External Care Failure Risk
Low-$50
Below 78% Average Capacity
MAX RANGE

387 km
78%
vs
498 km New
STATE OF HEALTH
USABLE CAPACITY
78%
58.3
kWh
vs
75.0 kWh
New Usable
PREMATURE FAILURE RISK
LowCELL TEMPERATURE IMBALANCE
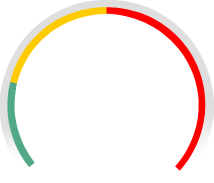 Low
Cell Voltage Test
100% Balanced
Fuel vs Electricity Cost Comparison
+$2,205 Annual EV Cost Savings
Annual mileage
1,000 km
80,000 km
Charging Time & Cost
Cell Voltage Values
Cell Voltage Histogram
*This report, and any reliance upon it, is subject to our terms of service. Patents pending. 38984A355348354654202020FF0B1E29 3.0.5 2.75 16816b51-a965-4c3f-bdc2-e152a420c098
Scan here for more details on your EV battery health.

EV Battery
Health Report
2018 Tesla Model 3 Long Range Dual Motor AWD
VIN: 5YJ3E1EB8JF109887
TEST TIME: 08/10/2026 5:53 PM
TEST STATE OF CHARGE: 69.5%
Odometer: 231,244 km
OEM Battery Warranty*: 8 years / 192,000 km
In Service: October 20, 2018
STATE OF HEALTH
MAX RANGE
387 km
78%
vs
498 km New
USABLE CAPACITY
78%
58.3
kWh
vs
75.0 kWh
New Usable
PREMATURE FAILURE RISK
LowCELL TEMPERATURE IMBALANCE
LowCell Voltage Test
100% Balanced
Fuel vs Electricity Cost Comparison
+$2,205 Annual EV Cost Savings
Annual mileage
1,000 km
80,000 km
Charging Time & Cost
Cell Voltage Values
Cell Voltage Histogram
*This report, and any reliance upon it, is subject to our (https://vsnew.com/terms). Patents pending.
38984A355348354654202020FF0B1E29 3.0.5 2.75 16816b51-a965-4c3f-bdc2-e152a420c098
Scan here for more details on your EV battery health.
https://app.vsnew.com/ev/19706-5YJ3E1EB8JF109887-2018-Tesla-Model 3 Long Range Dual Motor AWD